“Not just cool graphs: data journalism for investigations” – notes from the panel session at #ijf17
I’m at the International Journalism Festival in Perugia, and here are my notes from a panel about data journalism featuring my colleague Caelainn Barr alongside Mar Cabra, Daniele Grasso and Paula Guisado.
Daniele Grasso, El Confidencial
Daniele Grasso works at El Confidencial. It is often described as a start-up, and is a Spanish digital-only newspaper that has been running for 15 years, and now has a newsroom of around 120 people. Daniele says he acts as the bridge between his data team and the rest of the newsroom. He showed three reasons why he doesn’t just think his data team is essential to it, but why he knows it.
The first was an investigation into lawyers hired by the state in Spain. It was long suspected that lawyers representing the government sometimes acted in cases against companies and organisations that they also represented or consulted for, in a clear conflict of interest. A five month fight using Spain’s only recently introduced transparency laws saw them get the data that allowed them to prove this. A regular reporter or journalist, Daniele said, still struggles to understand the process to get this information.
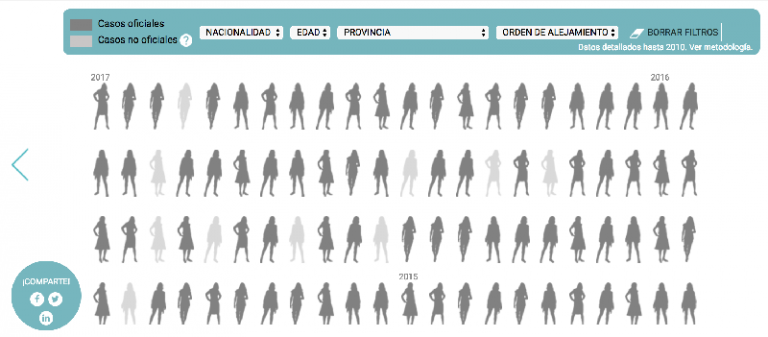
His team have also worked to build their own unique databases, either for internal or external use. One he showed has been tracking the deaths of women at the hands of their partners, and has recorded 800 incidences of women being killed by the men they are in relationships with since Spain introduced an anti-domestic violence law.
They also work on the big projects across the newsroom – although Daniele joked that in digital, anything expected to last longer than two days is considered a big project. He pointed to work on data releases like the Panama Papers, where the data team can do a lot of the heavy-lifting of sifting through the source materials, allowing reporters – who are super-stressed and always need to have had the info to have published yesterday – to get on with their lives.
![]()
Paula Guisado, El Mundo
Paula Guisado seemed a little less upbeat about the integration of the data team she works in with the rest of the newsroom. It’s a common refrain. “I’m a data journalist. Which means I can use Excel. We have a superpower of being able to sort columns” she said wryly. Like several specialist roles in the newsroom it is often hard for people to grasp exactly what a datajournalist is going to bring to the party.
She showed one El Mundo project which I really liked. In order to support transparency, politicians in Spain are supposed to declare their business interests. Many of them do this via the medium of uploading badly-scanned PDFs that can’t be read by either human eyes or OCR. Paula described how the data team embarked on a project to look at 300 of these, salvage whatever information they could from the scans, and then systematically approach the politicians to get the missing information, so that they had a readable database of it, and a newsworthy list of the people who weren’t prepared to reveal the details.
Paula also talked about the Football Leaks project. She made the brilliant point that multi-newsroom collaboration on these types of datasets entirely changes the way that the information enters the public domain, and the understanding of all the connections within it. She said that had the documents been passed to one journalist, they would have basically been set for life, with a never-ending set of stories. But the drip-drip-drip of one story a week about Ronaldo or somesuch owning a company wouldn’t have had the same impact as the co-ordinated release of the whole picture.
![]()
Caelainn Barr, The Guardian
My colleague Caelainn Barr is an award-winning data journalist on our data projects team, and she was explaining a bit behind the scenes about the recent Global Laundromat investigation.
Collaboration was a key part of getting this series of revelations out there, and Caelainn said it was important that they’d got the numbers to the investigative reporting team early on in the process, so that they could do the digging they needed. It also meant that the numbers and the data were weaved in as an integral part of the story, rather than just being a pretty graph tucked away at the side.
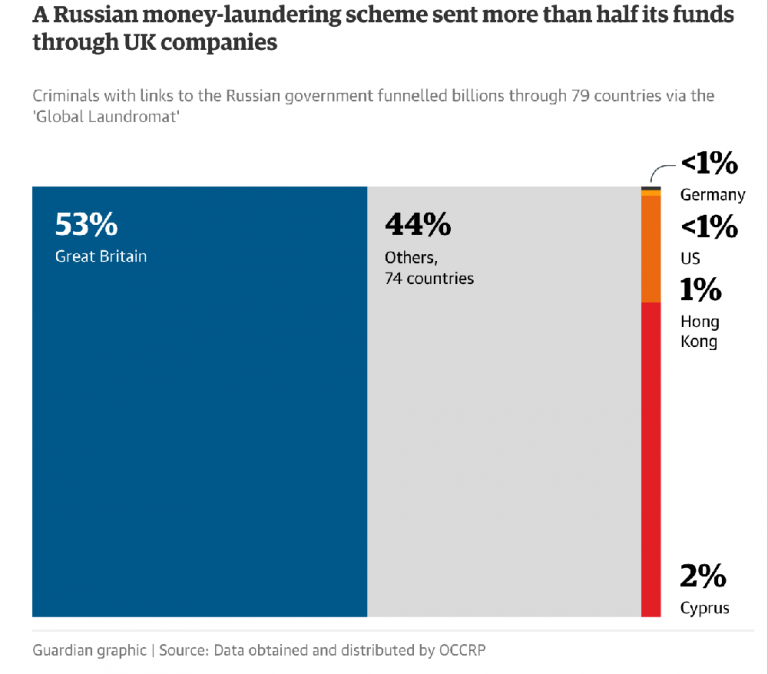
Caelainn explained that the investigation started when a reporter at the OCCRP started a was handed a bunch of documents which described financial transactions. The documents showed tens of thousands of transactions and about £20bn worth of money being siphoned out of Russia. They think it is still the tip of the iceberg.
When the Guardian got the data it was already well-structured, and the obvious focus for them was to look at UK companies at the heart of the money-laundering scheme, as well as British banks. They went through matching the transactions to the IBANN and SWIFT codes of British banks, and sure enough a lot of the money flowed through them, and nothing had been flagged up as unusual, despite, when they showed the data to the regulators, being transactions that should have raised alarm bells.
They then matched the data to some of the publicly available data about companies in the UK, and Caelainn joked that one of the companies at the heart of it all was registered to a London address that she walked past all the time on her way to the gym, not knowing that she walking past one of the HQs of the big investigation she was working on. Cross-referencing data with the Land Registry also allowed them to expose some of the assets “owned” by these “companies”.
Caelainn really stressed that having the data in the right format early had been vital. It meant not only could the data team perform these complex operations of matching massive datasets, it also meant that those without great data skills could still search the transactions for things like diamonds or chandeliers, and pull those transactions out and start investigating them. It gave everybody involved in the project early on a chance to really think about what they could uniquely bring to the investigation.
The session was called “Not just cool graphs” but Caelainn did confess that the Laundromat project had generated some cool graphics. “Sometimes,” she said, “the easiest way to explain a complex subject is with a graphic.”
![]()
I love data-journalism, and I do miss working directly with data-journalists as I did when I worked on Ampp3d. You can view the entire session online: “Not just cool graphs: data journalism for investigations“. Find all my blog posts from the 2017 International Journalism Festival.
I do newsletters, live blogging, news stories and quizzes at the Guardian, and help cover Eurovision and Doctor Who for them too. As a journalist and designer I’ve spent over 25 years building digital products for the likes of Sony, the Guardian, the BBC, the Natural History Museum, Arts Council England and Reach (formerly Trinity Mirror). You can contact me at martin.belam@theguardian.com. Sign up to get my blog posts sent to you via email.